Basic information
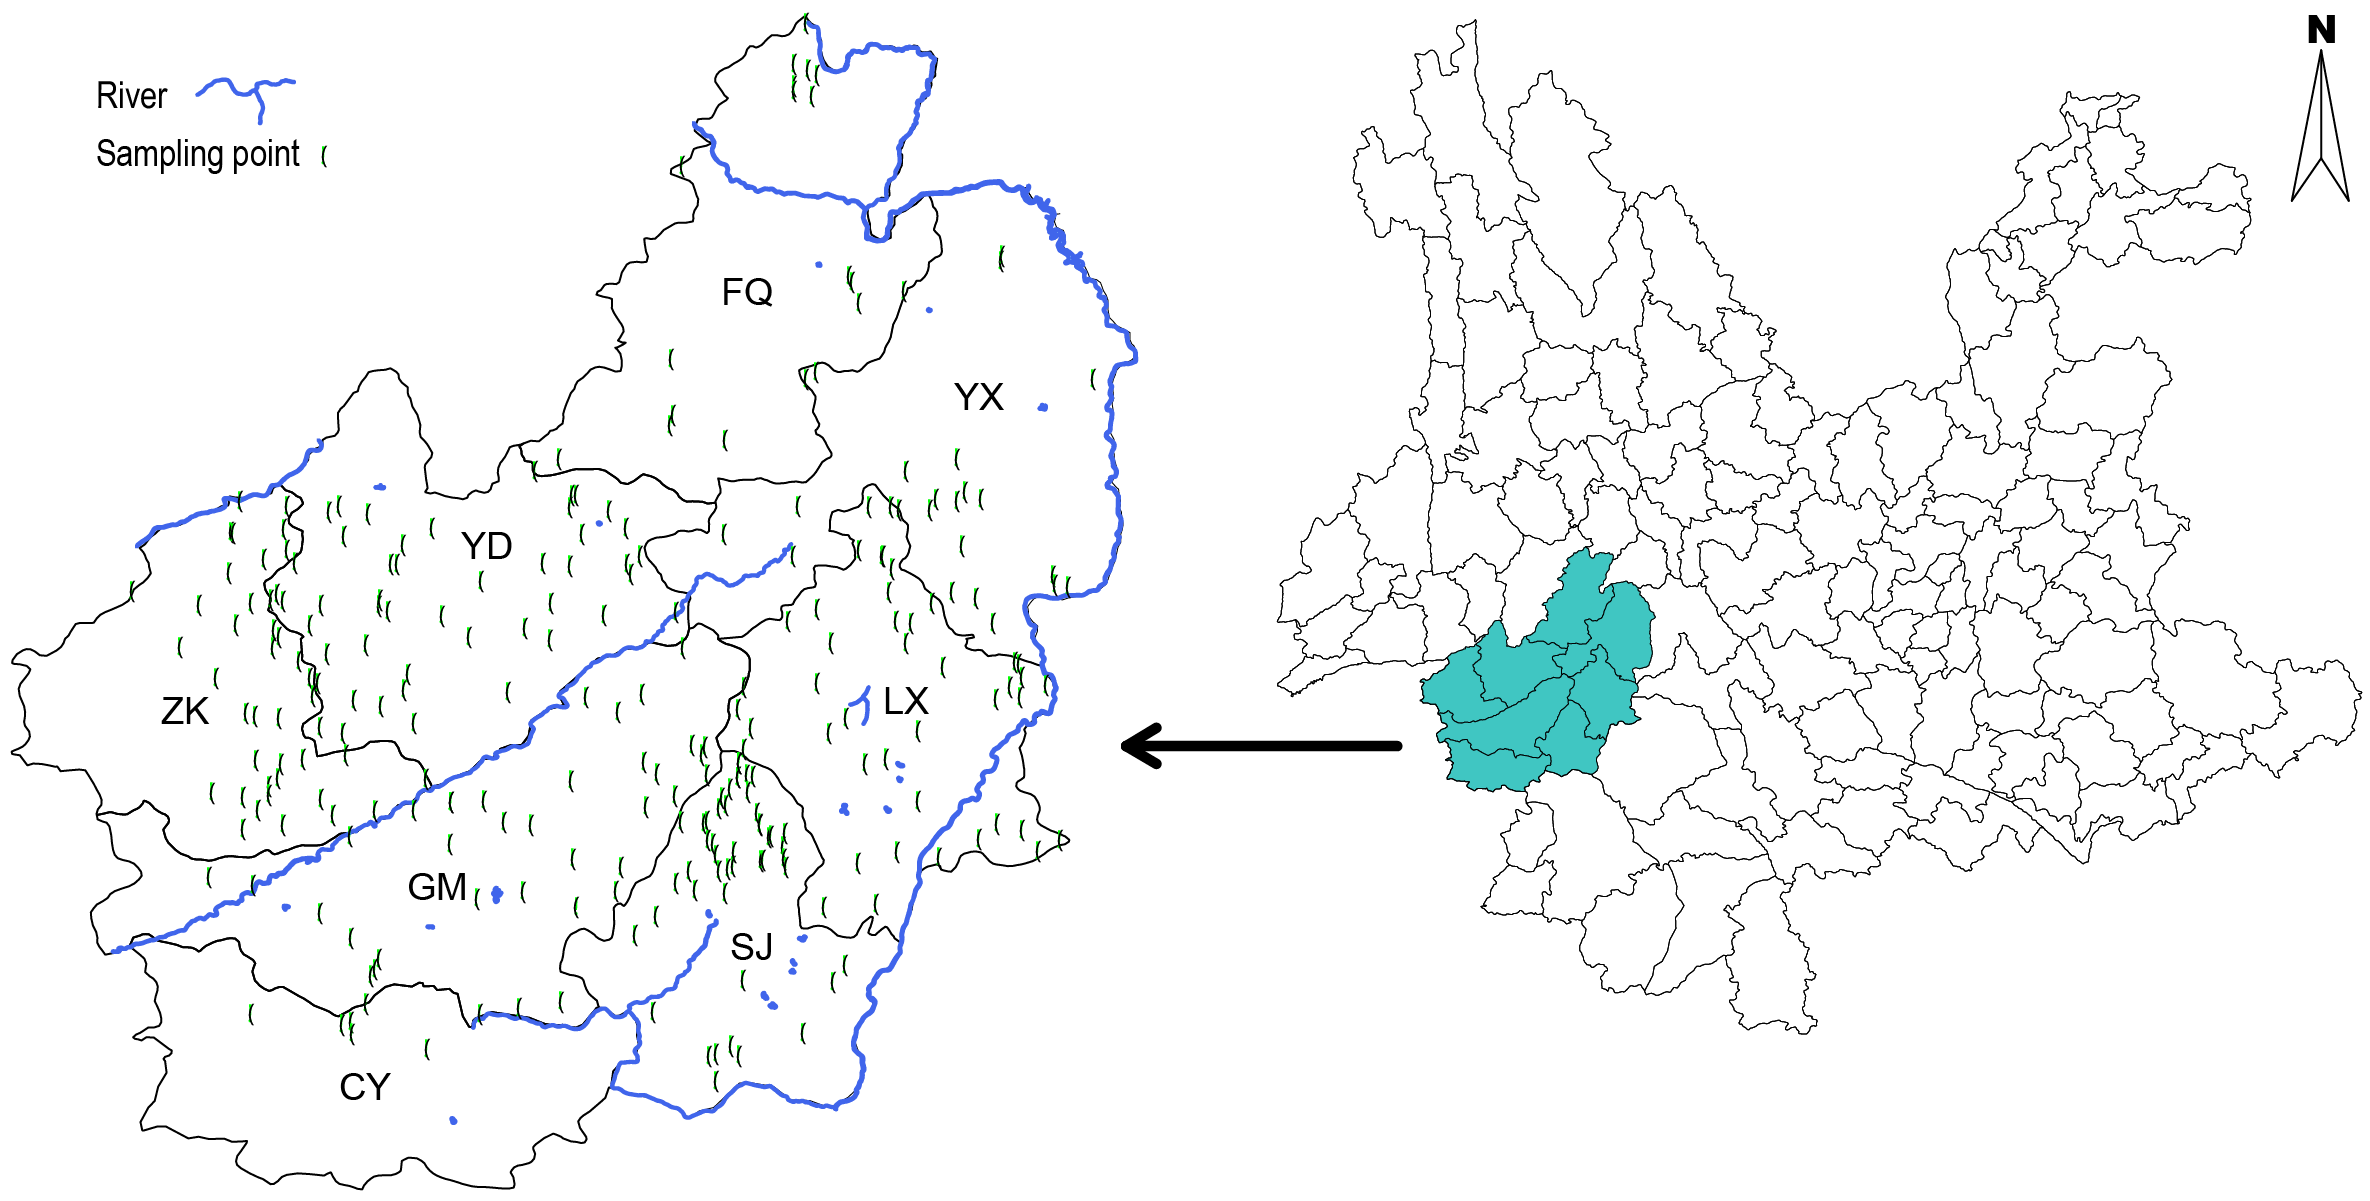
A lot of evidence shows that Yunnan is an important origin center for the cultivation of tea trees, and there is a lot of evidence of tea domestication in Yunnan. Especially in the Lancang River Basin, wild tea tree resources and ancient tea gardens are distributed. We collected more than 23,000 tea tree individuals of the main tea resources in the Lancang River Basin, and selected more than 1,000 individuals according to their geographical distribution for genomic analysis. These data reflect the genetic diversity of tea plant resources at the center of possible tea origin. The project is also known as the genome re-sequencing of 1,000 tea resources in Yunnan(1KGT in Yunnan). We hope that these data can be used as important data resources for research on the origin of cultivated tea
| Sampling Location | Number |
| Other | 116 |
| Cangyuan | 31 |
| Fengqing | 115 |
| Gengma | 78 |
| Linxiang | 235 |
| Shuangjiang | 291 |
| Yongde | 187 |
| Yunxian | 217 |
| Zhenkang | 81 |
Method:
Variant calling and annotationPaired-end reads were mapped to the reference genome of Camellia sinensis (Shuchazao) through BWA using default parameters. Conversion of SAM to BAM and exclusion of unmapped and multi-mapped reads were performed through SAMtools v1.3.1. Further, the duplicated reads were filtered out using Picard v2.1.1.1. After BW A alignment, the reads around indels were realigned. Realignment was performed with GATK 3.3-0-g37228af2 in two steps. First, we used the RealignerTargetCreator package to identify regions where realignment was needed, followed by a realignment of reads to these regions using IndelRealigner, and created a realigned BAM file for each accession. Then we detected the variation of each sample and obtained the original variation set file (gVCF format) through GATK Haplotype Caller, and gVCF files were further integrated to obtain population variation data. The SNP filter expression parameters were set as: QD<2.0 || MQ<40.0 || FS>60.0 || SOR>5.0 || MQRankSum < −12.5 || ReadPosRankSum < −8.0 || QUAL <30. The InDel filter expression parameters were set as: QD<2.0 || ReadPosRankSum< −20.0 || InbreedingCoeff < −0.8 || FS>200.0 || SOR>10.0 ||QUAL<30. Only insertions and deletions shorter than or equal to 40 bp were considered. Indels and SNPs with none bi-allelic, >50% missing calls and MAF < 0.005 were removed, which yielded the basic set. SNPs with MAF < 0.05, none bi-allelic, >50% missing calls were further removed for phylogenetic tree structure, genetic diversity analysis, LD decay, PCA and population structure analyses (the core set). The annotation of SNPs and InDels was performed through ANNOVAR using tea genome as a reference.
Phylogenetic analysisThe populations were clustered to assess the pattern of variation among the sampled populations. We used the whole-genome SNPs to construct the maximum likelihood (ML) phylogenetic tree with 100 bootstraps using SNPhylo v20140701. Camellia cuspidate was used as an outgroup. Color coding of the phylogenetic tree was done through the iTOL web server.
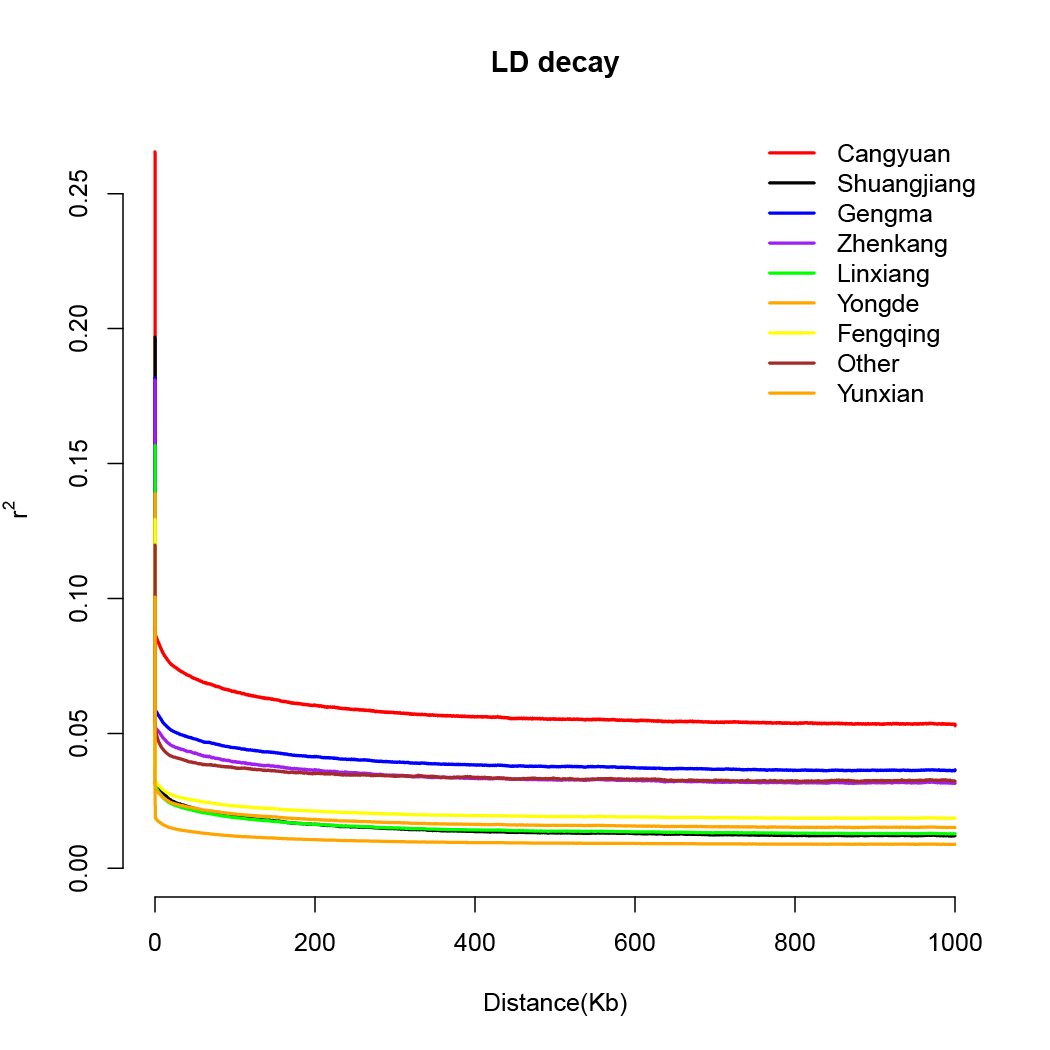
LD, population structure, and PCAThe SNPs in LD were filtered out using PLINK with a window of size 50 SNPs (advancing 5 SNPs at a time) and an r2 threshold of 0.5 to determine a pruned SNP set to be used in the population structure analysis. LD-based pruning reduces the effects of ascertainment bias in a relatively efficient manner. Principal component analysis (PCA) was performed with the Genome-wide Complex Trait Analysis (GCTA) v1.25.3, and the first three eigenvectors were plotted. LD was calculated using PopLDdecay v3.41. The pairwise r2 values within and between different chromosomes were calculated. The LD for each group was calculated using SNP pairs only from the corresponding group. The population structure was analyzed using the ADMIXTURE program with a block-relaxation algorithm. To explore the convergence of individuals, we predefined the number of genetic clusters K, from 2 to 9 and ran the cross-validation (CV) error procedure. Default methods and settings were used in the analyses.
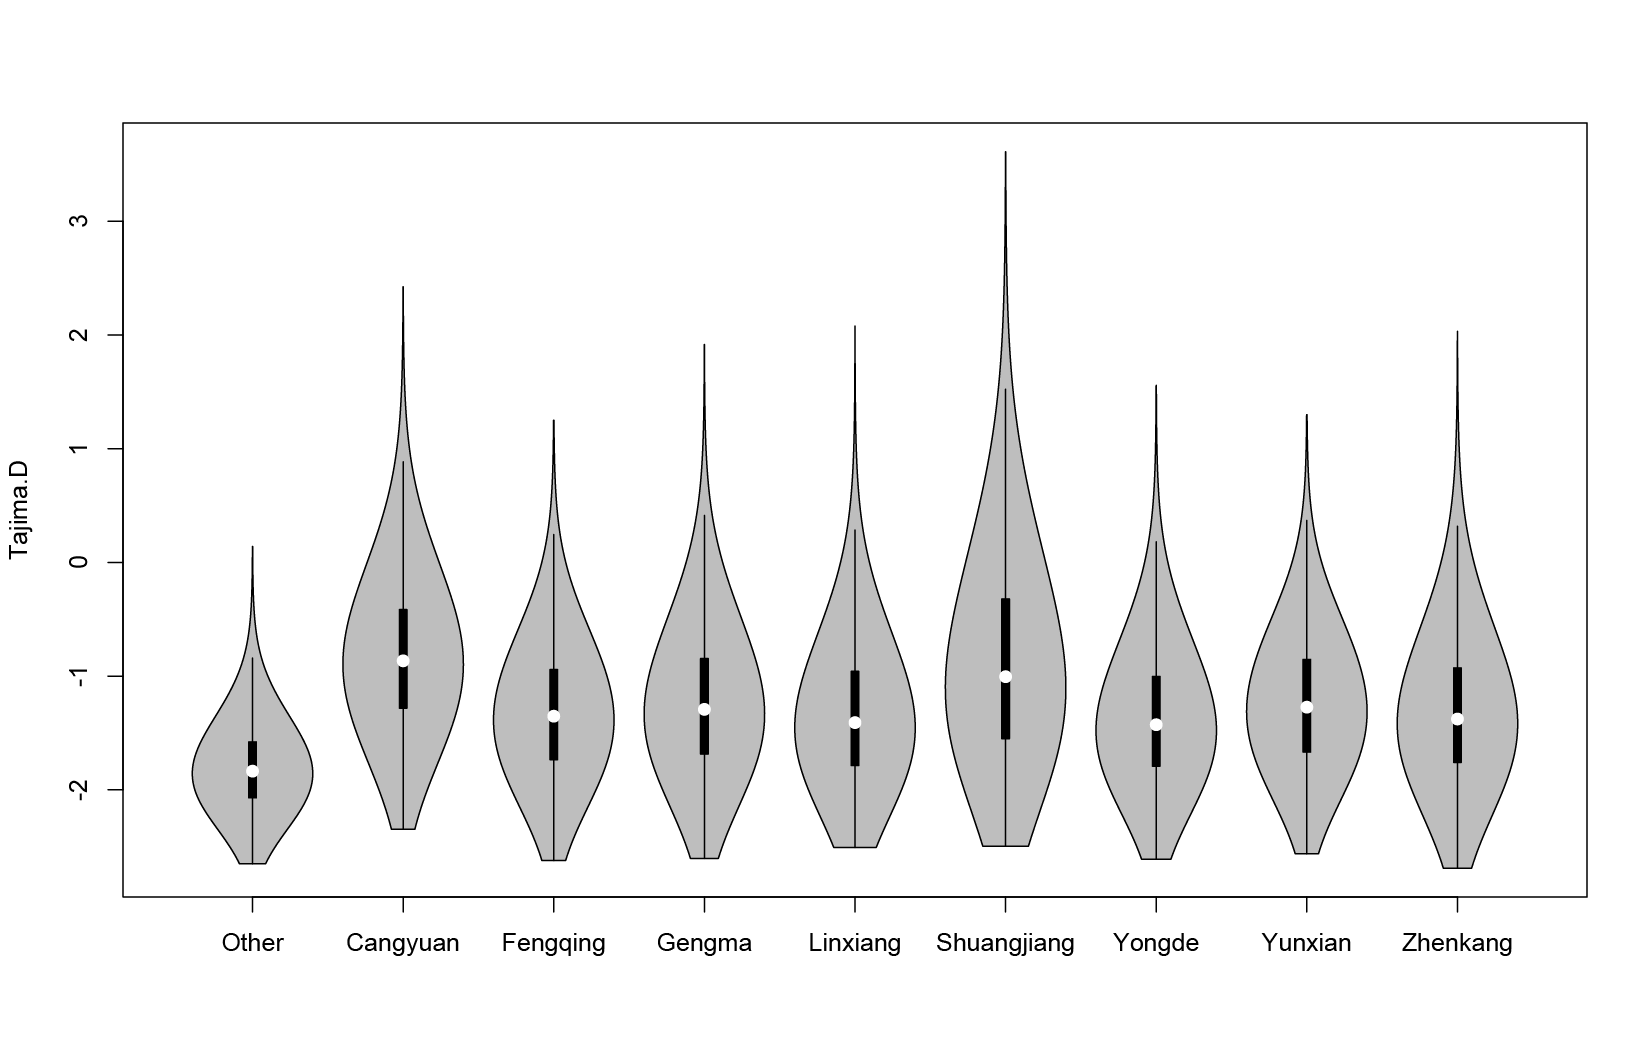
Genetic diversity analysis and population differentiationThe primary genetic diversity parameters like observed heterozygosity (Ho), expected homozygosity (He), inbreeding coefficient (F), the average pairwise diversity within a population (θπ), and Tajima’s D were calculated using the vcftools with 100 kb sliding windows. In addition, overall genetic differentiation across populations measured by Weir and Cockerham’s estimator of FST was also calculated using the same software.
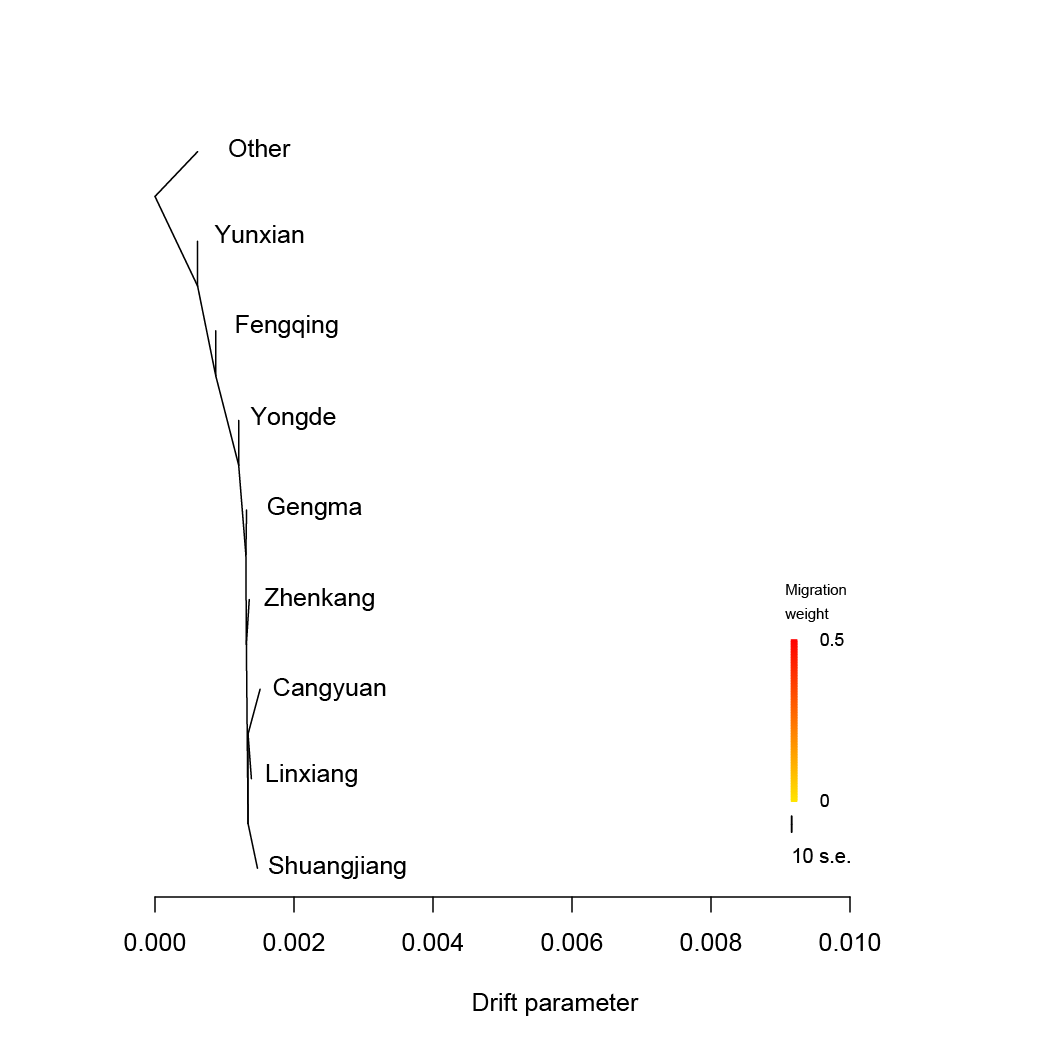
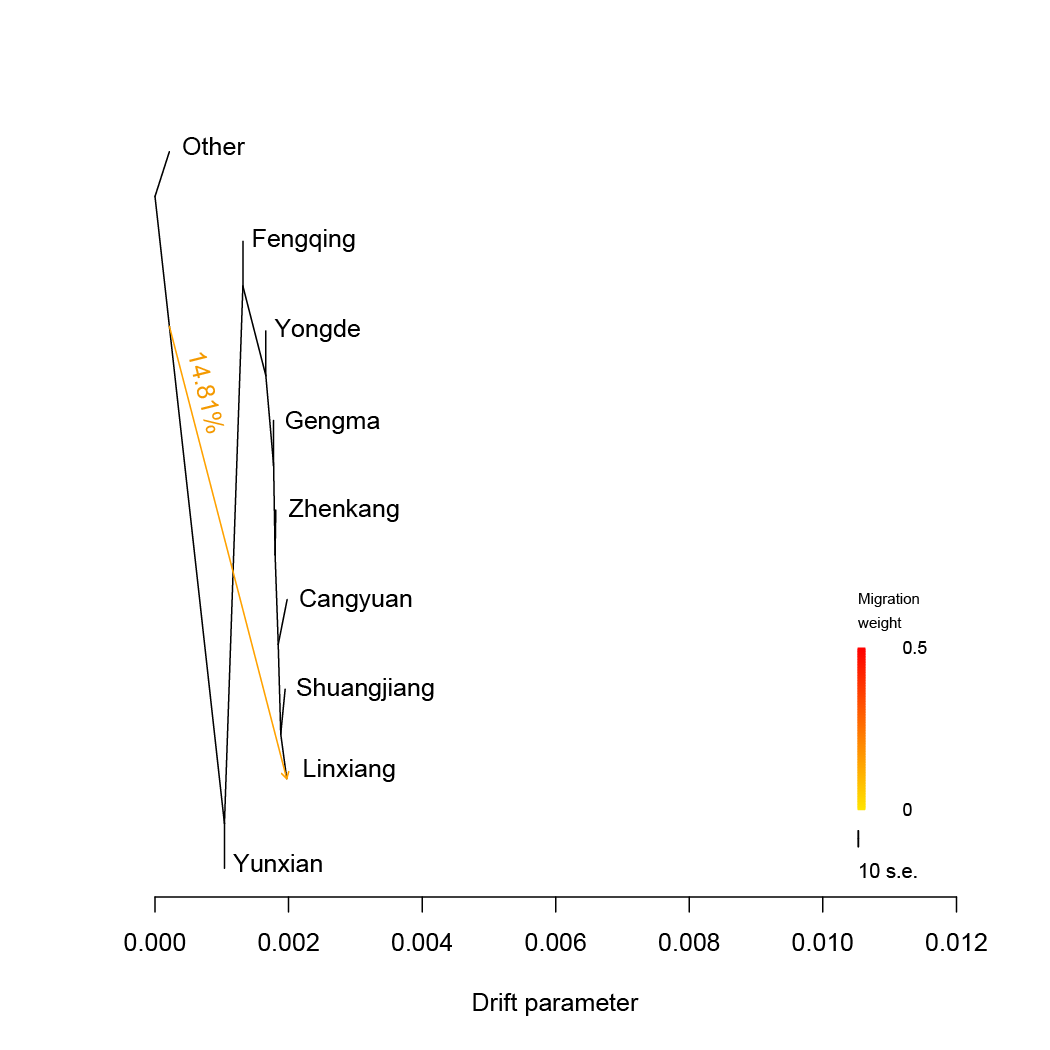
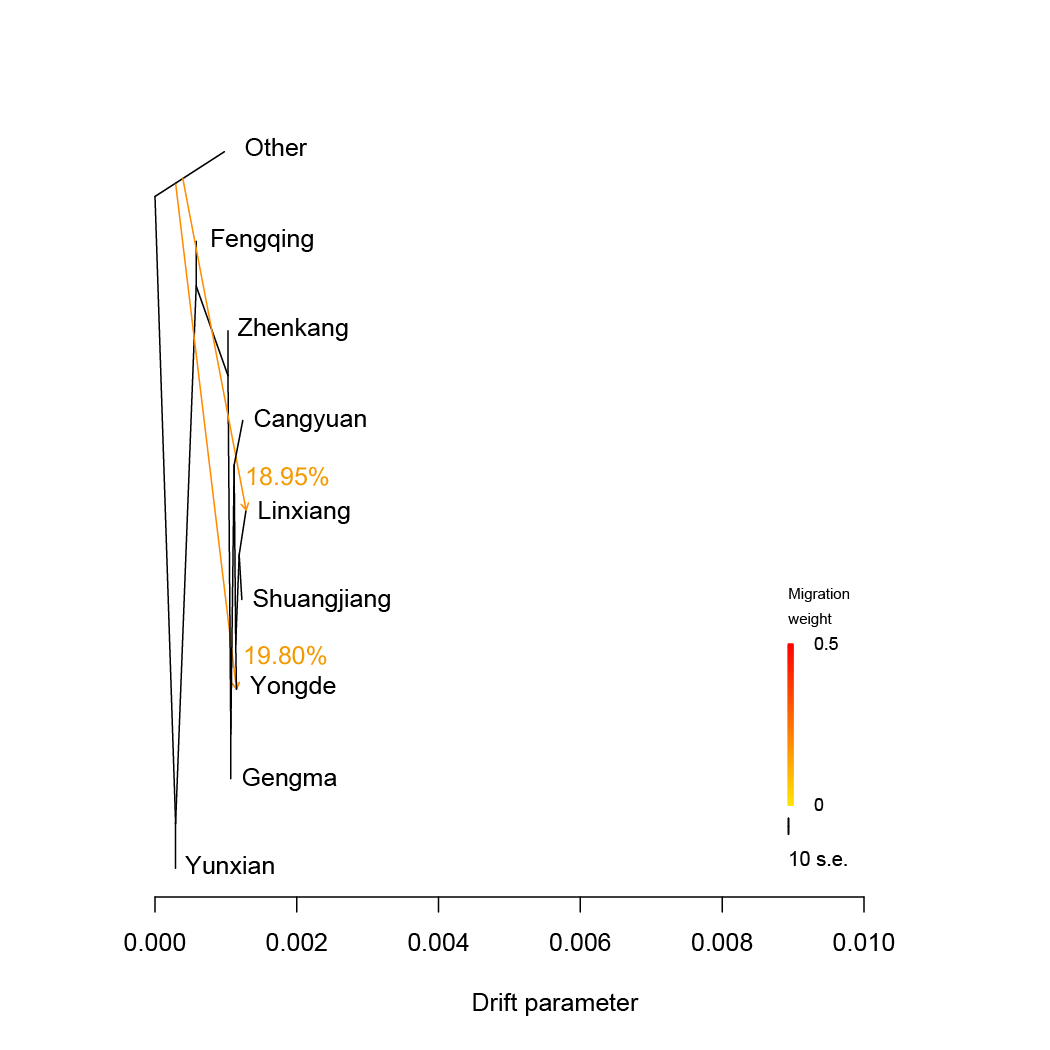
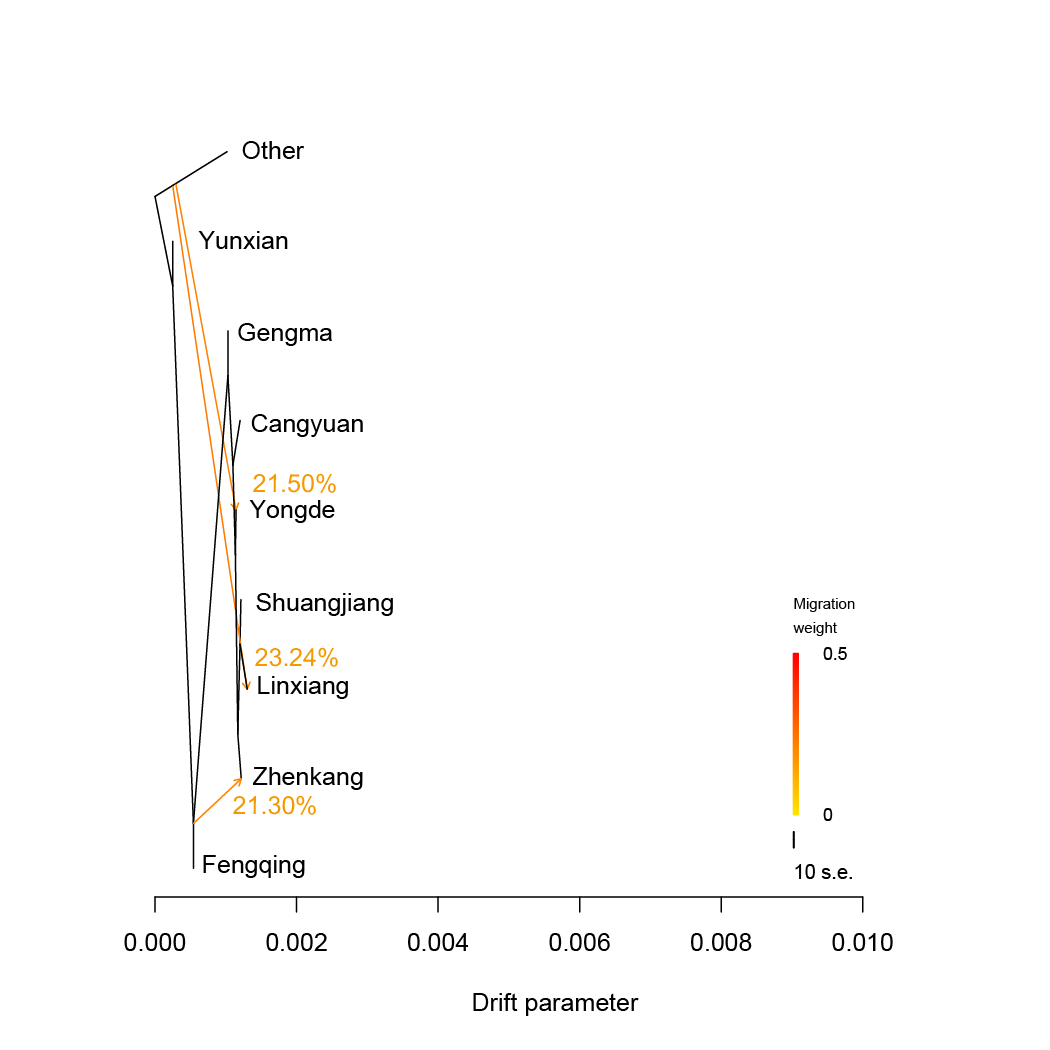
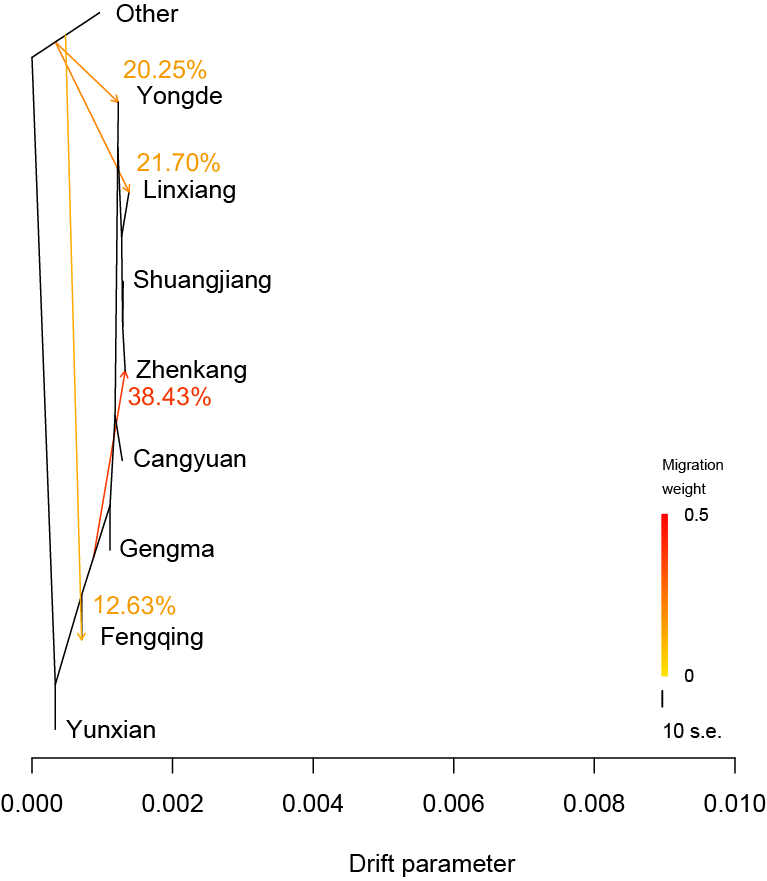
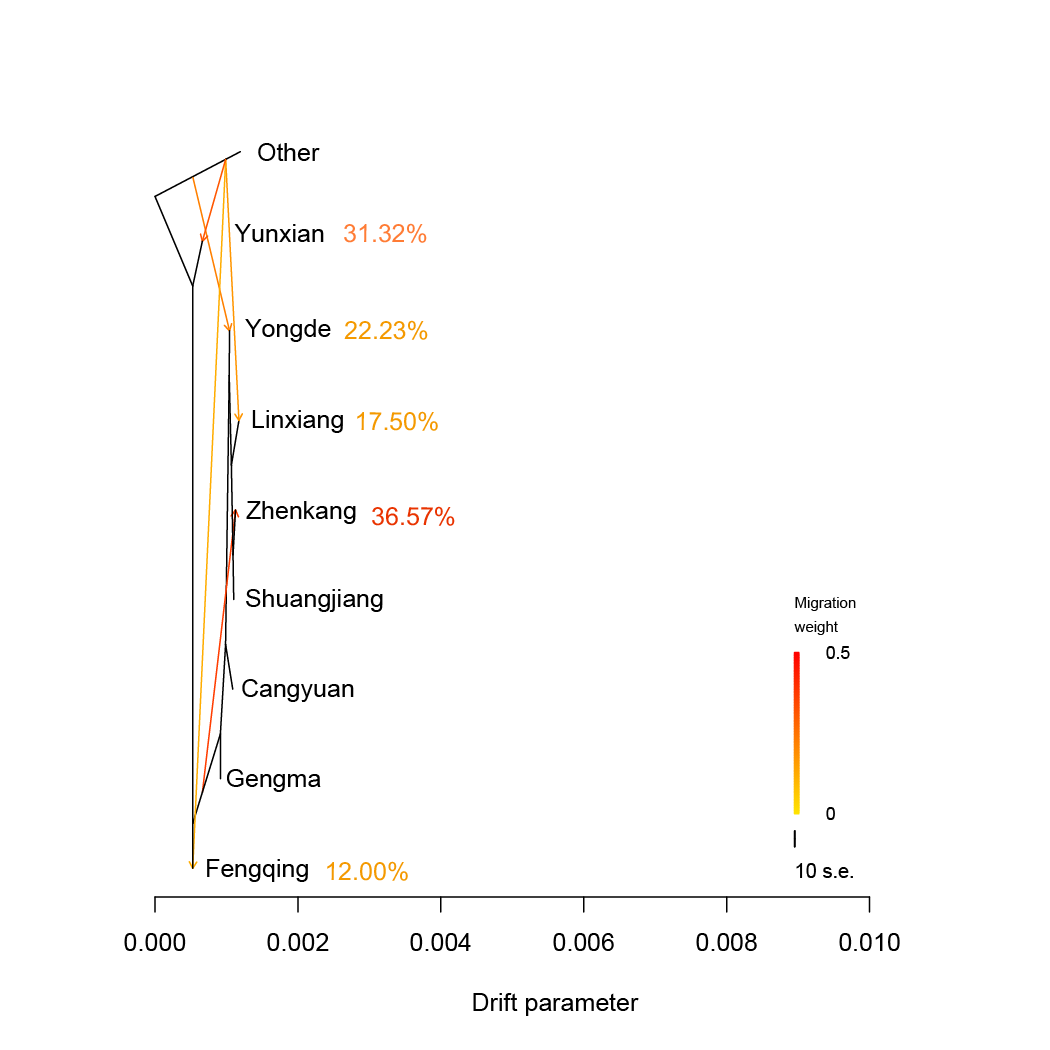
TreeMix.We estimated admixture graphs of geographically defined Lingcang tea populations using TreeMix, which uses a Maximum Likelihood (ML) method based on a Gaussian model of allele frequency change. The topology of the ML trees changes depending on the number of migration events (m) allowed in the model. Here we use m=1 to m=5. The bootstrap values on the tree are based on 1,000 replicates. Arrows on the graph represents admixture events between different tea populations. The Other tea population was used for root.
Suquencing information
Variation information
| Variants | Type | Core Set |
|---|---|---|
| SNPs | Total | 27,550,879 |
| Intergenic | 25,170,861 | |
| Intronic | 1,327,890 | |
| Exonic | 395,863 | |
| 5’-UTR | 36,049 | |
| 3’-UTR | 81,272 | |
| UTR5;UTR3 | 237 | |
| upstream | 251,002 | |
| downstream | 277,265 | |
| upstream;downstream | 6,095 | |
| Splicing | 4,150 | |
| exonic;splicing | 195 | |
| Indels | Total | 1,139,750 |
| Intergenic | 950,567 | |
| Intronic | 118,677 | |
| Exonic | 14,064 | |
| 5’-UTR | 3,715 | |
| 3’-UTR | 8,271 | |
| UTR5;UTR3 | 9 | |
| Splicing | 399 | |
| upstream | 19,862 | |
| downstream | 23,608 | |
| upstream;downstream | 569 | |
| exonic;splicing | 9 |
Phylogeny
Principal Component Analysis (PCA)
ADMIXTURE Analysis
Genetic Differentiation
Decay of linkage disequilibrium
TajimaD and π
| SampleNum. | pi | TajimaD | |
|---|---|---|---|
| Other | 116 | 0.00137303 | -1.77276 |
| Cangyuan | 31 | 0.00177665 | -0.809721 |
| Fengqing | 115 | 0.00153388 | -1.29516 |
| Gengma | 78 | 0.0015963 | -1.21387 |
| Linxiang | 235 | 0.00128268 | -1.31435 |
| Shuangjiang | 291 | 0.00107112 | -0.85678 |
| Yongde | 187 | 0.00126514 | -1.33971 |
| Yunxian | 217 | 0.00164665 | -1.21854 |
| Zhenkang | 81 | 0.00122214 | -1.28174 |

TreeMix
