Sampling information
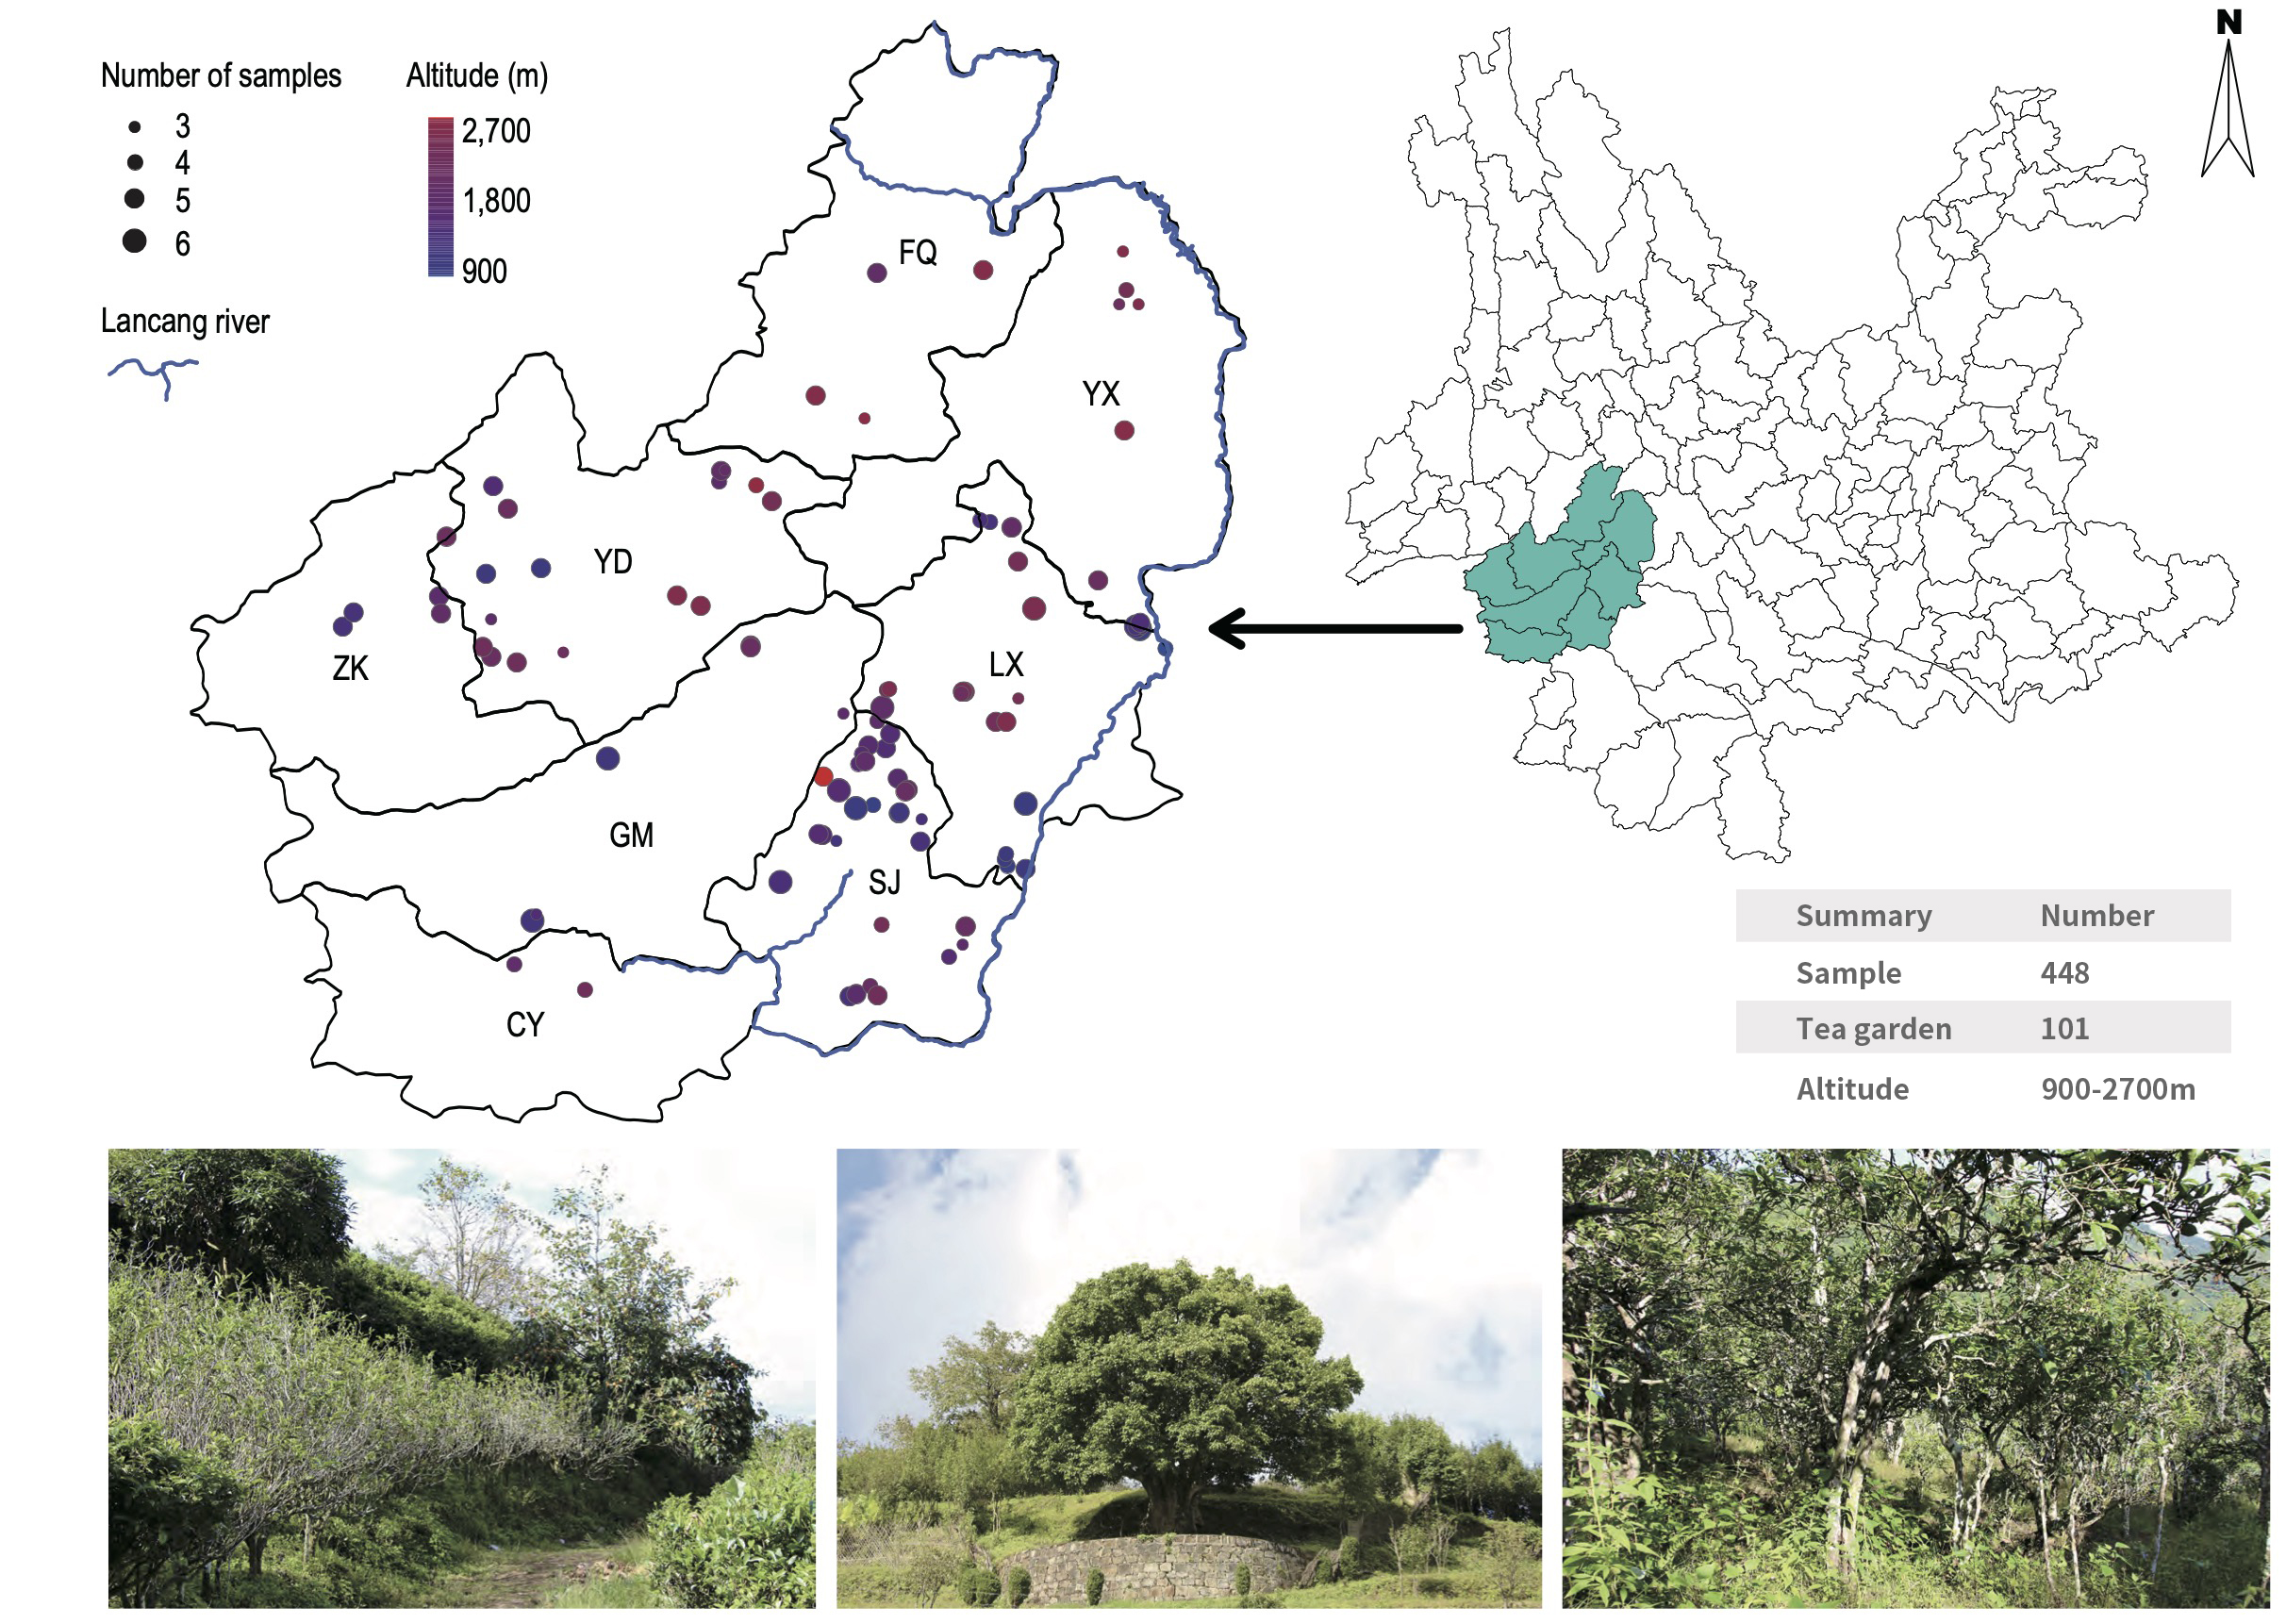
In the special ecosystem of ancient tea plantations, many factors, including environment, geographical issues and human behaviors in the tea plantations, will affect the soil microorganisms, tea plant growth and tea quality, as well as tea quantities of the tea garden. In this research, to explore the structure and composition of different communities of soil bacteria and/or fungus, so that we can clarify the main influencing factors and the relationship with soil microorganisms, and provide a theoretical basis for tea breeding and resource protection in future. We selected the bacterial and fungal communities in 448 soil samples from 101 ancient tea plantations in 8 counties (Linxiang, Shuangjiang, Gengma, Cangyuan, Zhenkang, Yongde, Yunxian and Fengqing) of Lincang City, based on 16S and ITS rRNA high-throughput sequencing, to characterize the microbial community of the tea plantation soil.

Method:
Statistical Analysis and Data VisualizationThe paired-end raw reads were grouped based on their barcode sequences. Then, the paired reads were merged to obtain amplicon sequences using FLASH (version 1.2.7) (Magoč and Salzberg, 2011). The barcode and primer sequences, as well as the low-quality amplicon sequences, were removed using QIIME2 (v2019.10) (Bolyen et al., 2019). We used UCHIME (Quast et al., 2013) (parameter default) to detect and remove the chimeric sequences. Thus, clean amplicon data were generated, which were used for downstream analysis. The quality amplicons were then clustered into OTUs using Uparse (v10.0.240) (Edgar, 2013) based on a similarity threshold value of ≥97%. A representative sequence of each OTU was selected for further analysis. The representative sequences were aligned against the SILV A 132 database (for 16S rRNA sequences) (Abarenkov et al., 2010)to determine their taxonomic affiliations. Furthermore, to investigate the phylogenetic relationships among the OTUs, multiple sequence alignments were performed using Muscle (v3.8.31) (Abarenkov et al., 2010). QIIME2 (v2019.10) was used to calculate Weighted Unifrac distances and to construct UPGMA clustering trees.
Genetic diversity analysis and population differentiationA library was set up to sequence 448 samples, two samples with low sequencing quantities were excluded, and 448 samples were analyzed using the 16S-SNAPP program. α-diversity, a measure of species richness and uniformity, represents the diversity within a sample. We used R v4.1.1 vegan package to calculate the Richness and Chao1 index to reflect the complexity and diversity of species in the samples. β-diversity represents the differences in the microbiome among the samples. We were based on bray distance to analyze PCoA, NMDS, and CPCoA, and by non-parametric test methods of Anosim, Adonis, and MRPP to analyze for the difference of group-to-group. Kruskal-Wallis’s test of the agricolae package counted the differences between multiple groups. Veen plot was performed on the VennDiagram package; the heat map was plotted for visualization in the heat map package. Moreover, we used the ggplot2 package to plot the histogram, violin plot, and scatter plot.
Microbial community structure

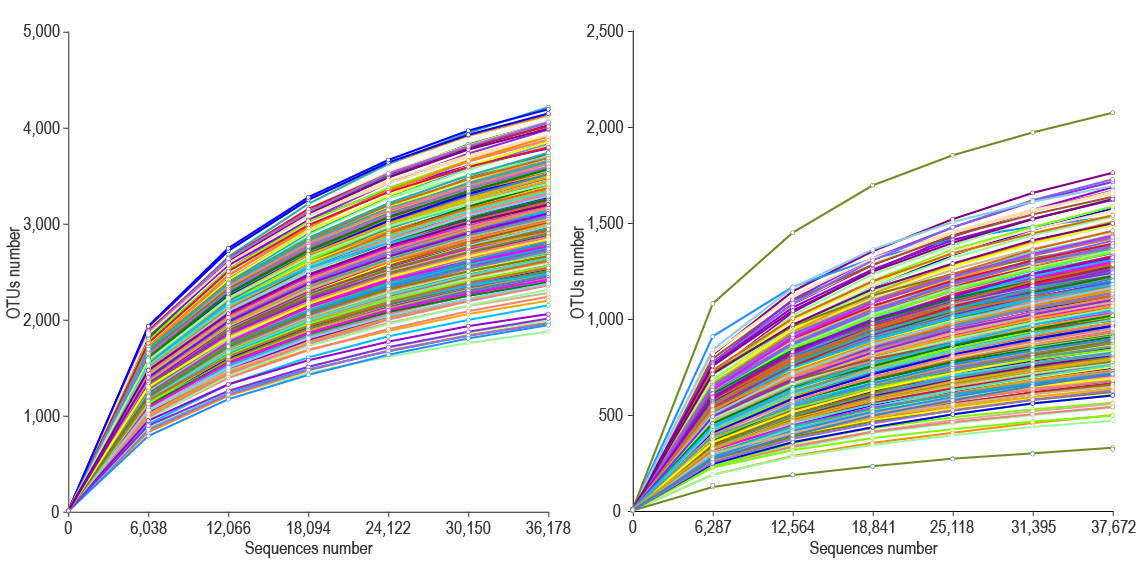
Rarefaction curves of bacterial and fungal communities.

Relative abundance of soil bacterial and fungal communities in 101 ancient tea plantations. (a) Relative abundance of bacteria at the phylum classification level (first 10 bacterial phylum, same below); (b) relative abundance of fungi at the phylum classification level (first 10 fungi phylum, same below). (ATP: ancient tea plantation).
.png)
.png)
.png)
.png)
Annotation of OTUs of all soil samples at the phylum and family classification level of bacteria and fungi
Environment alter microbial community structure
| Environment/Geographic | Bacterial | Fungal | ||
|---|---|---|---|---|
| R | P | R | P | |
| pH | -0.0084 | 0.6757 | -0.0084 | 0.684 |
| Lo | -0.0013 | 0.5254 | -0.0013 | 0.5236 |
| La | 0.0354 | 0.0169* | 0.0354 | 0.0166* |
| Al | 0.0406 | 0.0047** | 0.0406 | 0.0044** |
| Lo+La | 0.0196 | 0.1345 | 0.0196 | 0.1389 |
| Lo+Al | 0.0061 | 0.3712 | 0.0061 | 0.369 |
| La+Al | 0.0441 | 0.0044** | 0.0441 | 0.0070** |
| Lo+La+Al | 0.022 | 0.1074 | 0.022 | 0.1049 |
| pH+Lo+La+Al | 0.0113 | 0.2685 | 0.0113 | 0.2825 |
.png)
.png)
Spearman correlation analysis
pH shape the microbial community structure
.png)
.png)
.png)
Relative abundance and α-diversity index of soil bacterial and fungal communities in different pH gradient groups

NMDS analysis of soil bacterial and fungal communities in different pH groups.

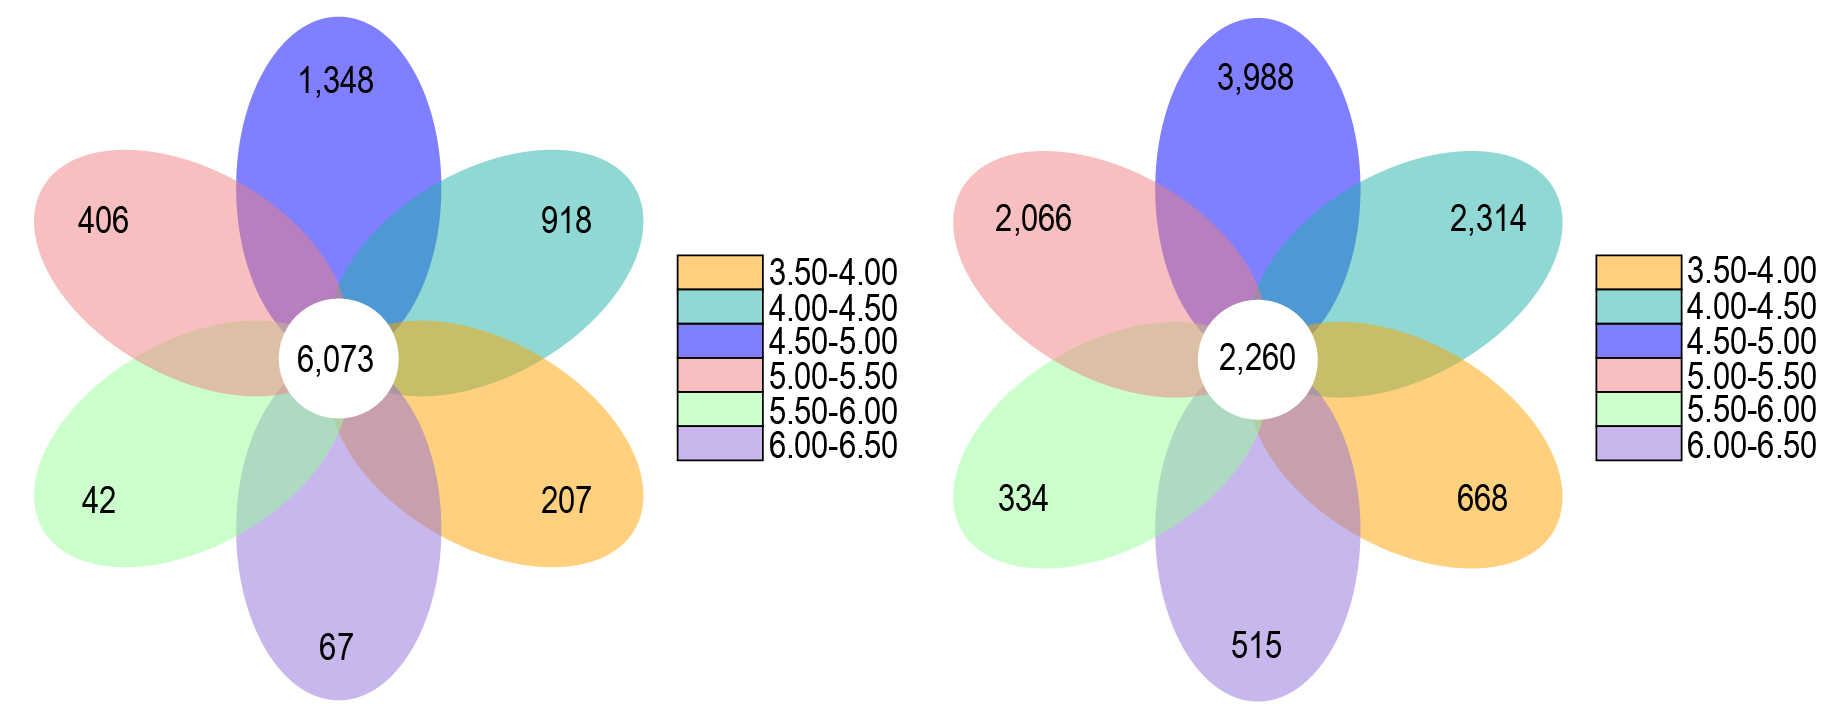
OTUs petal graph analyses of the soil bacterial and fungal communities in in different pH groups.
Altitude shape the microbial community structure
.png)
.png)
.png)
Relative abundance and α-diversity index of soil bacterial and fungal communities in different altitude groups.

NMDS analysis of soil bacterial and fungal communities in different altitude groups.

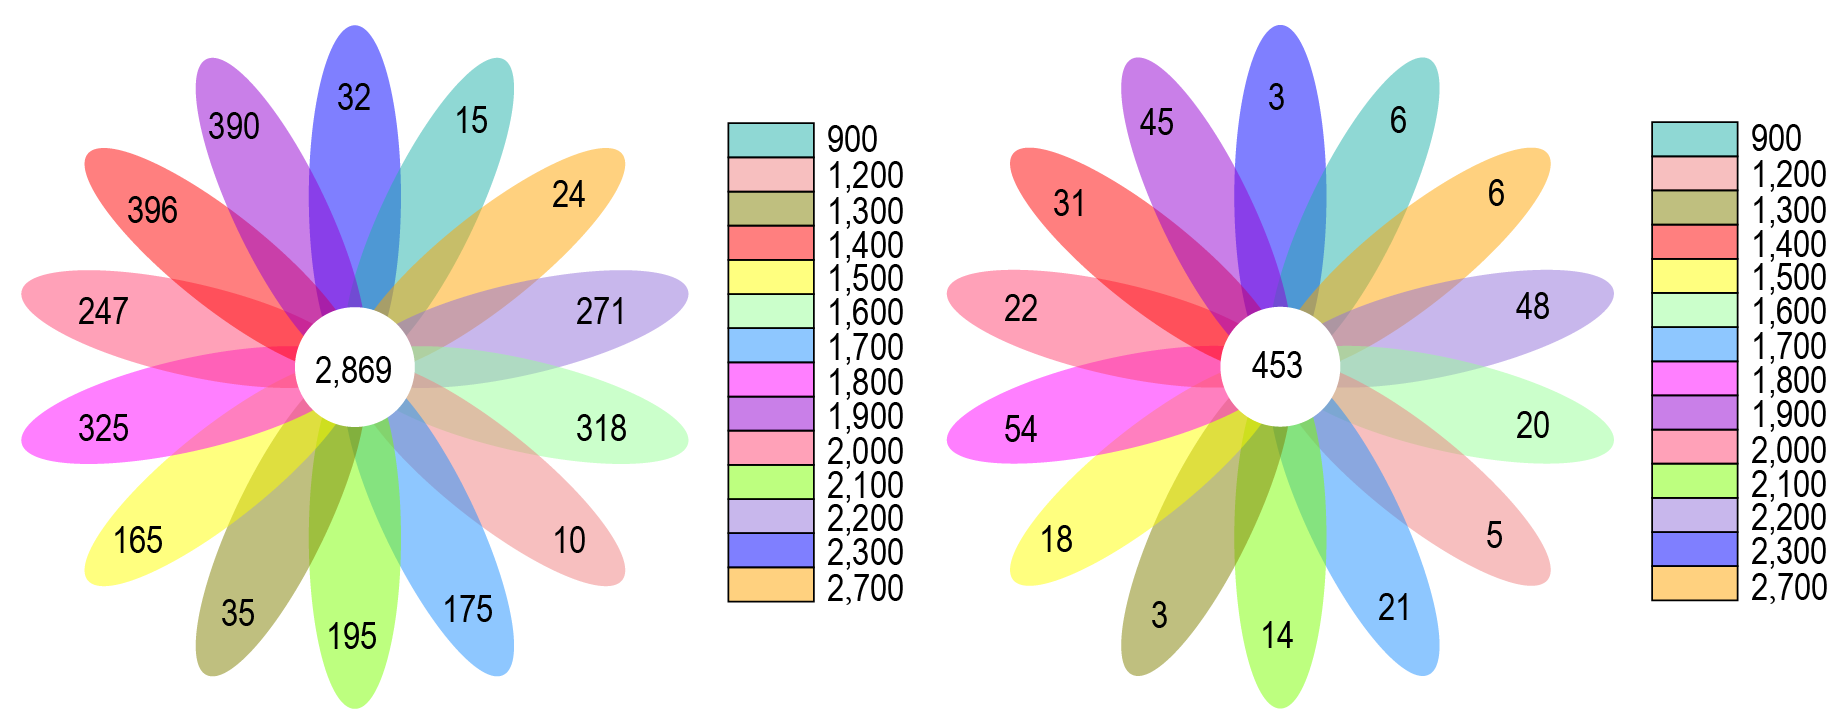
OTUs petal graph analyses of the soil bacterial and fungal communities in in different altitude groups.
Location shape the microbial community structure
.png)
.png)
.png)
Relative abundance and α-diversity index of soil bacterial and fungal communities in different location groups

NMDS analysis of soil bacterial and fungal communities in different location groups.

OTUs petal graph analyses of the soil bacterial and fungal communities in in different location groups.
OTUs related to environment factors
.png)
.png)
.png)
.png)
Spearman correlation analysis:bacteriophyta,Eumycophyta,bacterium,Eubacterium